![]()
What else can you do with your GPS-receiver when you are bored? Besides geocaching, stomping signs in corn fields and
drawing of comics one can now abuse a GPS to image the surrounding landscape as a silhouette in the light of the GPS-satellites.
This idea is not completely new. But here I can offer a DIY-program for everyone who possesses a GPS with NMEA-output.
For being able to calculate its own position coordinates a GPS receiver has to know the positions of the satelites in their orbits at least as precise as it wants to get its own position. So it knows
their position in the sky. En passant the GPS measures the signal strength with which each satellite is read. These both ingedients are sufficient to image the surrounding
in the microwave "light" of the satellites. The reduction in power by absorption, reflection, refraction and diffraction of the microwaves by objects between satellite and receiver allows a view with "hyperspectral"
vision.
Most GPS-devices offer a serial port that can deliver data in the so-called NMEA-format to an external computer. In the wealth of information that is broadcasted repeatitively over
NMEA is a list of the currently potentially "visible" satellites (GPGSV sentence) and their respective signal strength (SNR-signal to noise ratio).
I have knitted here a program in Delphi that can receive and process such a NMEA-data stream. To use this program with your GPS-receiver set the output format to NMEA which is
standardized to the parameters 4.8kBaud, 8bit, no parity, one stopbit.
The delivered range of values for SNR is most probably different for the broad variety of GPS-devices. My etrex vista delivers reception values between 34 and 51 or 0
if no reception is possible. To end up with smooth grayscale images despite of this gap in value range I substract 30 from all values (besides 0). Who likes to do so can send me NMEA-logs of other
devices for that I can learn about the possible range of values.
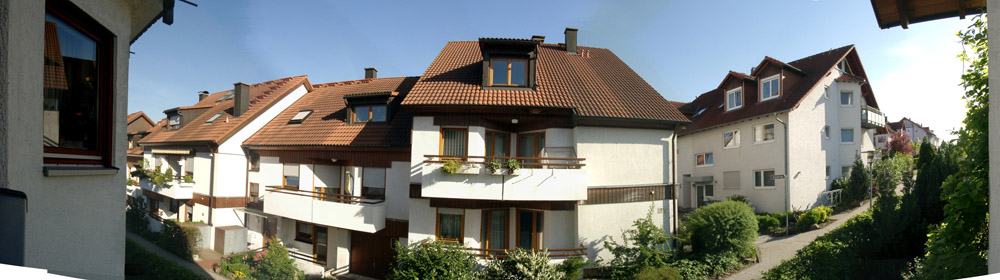
The next image, for instance, shows how the panorama lookes like from the vantage point of my balcony rail, on which I laid my GPS for that experiment.
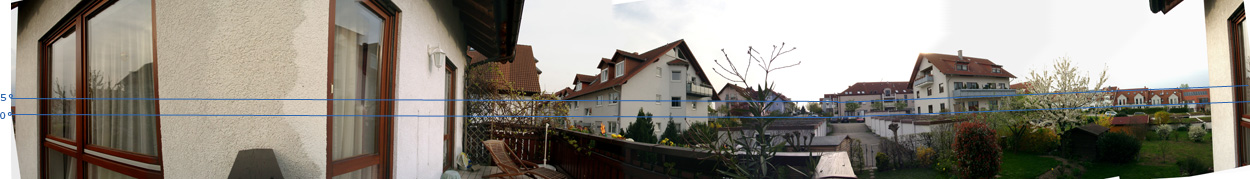
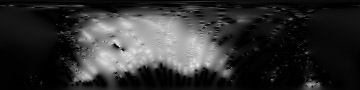
If I let record my program the trails of the sats for 2 days it delivers that corresponding image:
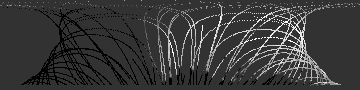
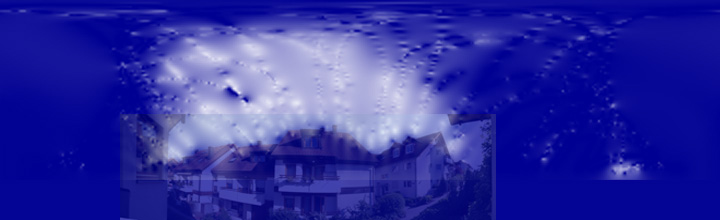
The horizontal alignment of the images does match very good, whereas the vertical angular range in the photographic panorama is much smaller. The GPS-image has 360 pixel for azimuth in the horizontal axis
and 90 pixel for elevation angle in the vertical axis, so both have 1° resolution. Outer left and right ends are north direction, there the panorama should be stitched
together. The order of directions from left to right is N-E-S-W-N. The trails of the sats generally start just 5° above horizon, this seems to be an arbitrary threshold defined by the
GPS receiver to accout for the increasing TOF uncertainty caused by the long way through athmosphere. I have drawn the horizon and the 5° line also in the classical panorama.
Through the NMEA protocoll the position of the satellites is only transmitted with 1° resolution, for higher resolution I could add in the future an interpolation of positions or
a direct calculation from almanach data.
To let the images look a little more pleasing I added an interpolation that delivers a hole free grayscale picture.
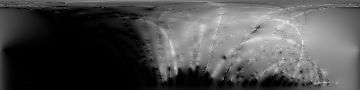
I recommend switching off WAAS/EGNOS reception, otherwise two bright spots (in Europe) will spoil the image.
I would be glad, if I will receive interesting pictures from the sights of the world or pictures interesting from technical point of view, which I would like to present here.
How will look Eiffel-tower, Taipeh 101 or the wooden planks in the roof in a GPS silhouette?
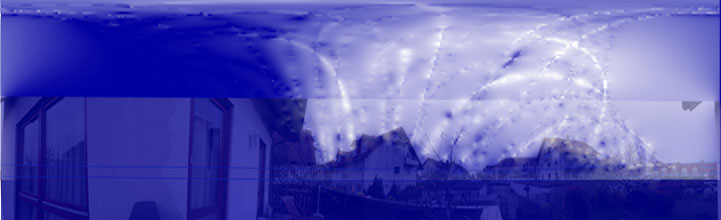
One more example:
 |
If a GPS with the right RS232 parameters gets plugged onto COM1, the program will be immediately ready to receive. If the GPS is connected to another or virtual (untested) port one can select
the port in the upper left corner of the window. When successfully receiving values, numbers >0 are displayed behind the 'characters received' line. To save a little from the necessary processing power (notebook running
time) one can deactivate the updating of the images. For an intentional interruption of reception, for instance for laying out the GPS, one can interrupt the processing of the stream
with the checkbox. With "log to disk" one can save a protocoll of the GPGSV sentences. The skyview to the left shows the positions of the sats and their receiving strength similar like GPS-handhelds do it. The upper rigth image shows the coverage of the panorama with sat traces and the number of GPGSV-Messages having been received for each point. The current positions of the sats are shown as red dots. The second image shows the averaged signal strength for each point of the sky, that has been visited by a satellite at least once. Like described above, the jump in signal strength values is ironed out. The interpolation of the values between the trails is unfortunately so calculating time expensive, that it cannot be run automatically alongside. The corresponding button has to be clicked and the calculation can last minutes. At the time its a weighed average (by distance^3) and with an arbitrary cutoff (relevance) distance. As distance measure the arc on a "great circle" on a (half-)sphere is used. The small quadratic image below is again a skyview, a look from above. Under the menu entry "file" one can save the images and also save and load the raw-data to be able to abort and resume the acquisition. Under "action" one can reset the already acquired data to start over with a "white sheet of paper". |